
Higher-dimensional Classification of Volume Data in Medical Applications
Bachelor Thesis of Lin Lin
Motivation
Today, the medical scanners, such as Computed Tomography (CT), Positron Emission Tomography (PET) and Magnetic Resonance Imaging (MRI), are regarded as the standard tools for diagnosis and treatment in the area of medicine. With the help of computer graphics techniques, these multi-modality medical image data can be inspected and handled easily by doctors. To investigate the interactive visualization of volumetric data from scanners, especially the visualization of cardiac disease data, the software Volume Studio is developed. Classification is one core part of the software. It is responsible for mapping the data values of the volume to a set of optical properties, so the user can highlight the interested regions and makes the unimportant parts transparent. In general classification is specified by transfer functions. In the previous work the 2D transfer function has been implemented. But in some complex cases, such as there are no obvious arcs in the histogram, or the arcs are overlapped with each other, then it is not easy to locate the material boundaries by using 2D transfer functions. Higher-dimensional transfer functions should be introduced to solve these problems.
Objectives
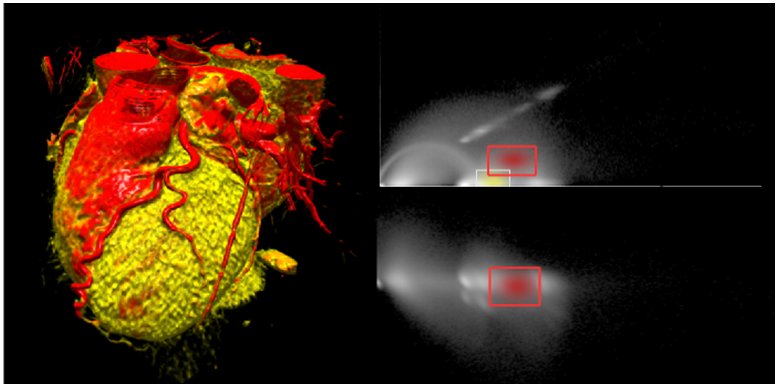
The main objective of this thesis is to find a proper way to construct 3D classification for Volume Studio. Based on the previous work and boundary model, it is believed that higher-dimensional classification can better visualize the boundaries between multiple materials by using more information. The inputs of 3D classification are data value, gradient magnitude and the second direction derivative. To realize the readily interaction between the user and the software, intuitive GUI and hardware-accelerated techniques should also be taken into account. The evaluation of 3D classification results is also one objective of this thesis. On one hand the results of 2D and 3D classification will be compared on the base of image quality. On the other hand, a numerical-analysis-based evaluation between 2D and 3D classification will be introduced to give the user a more direct impression.
Implementation
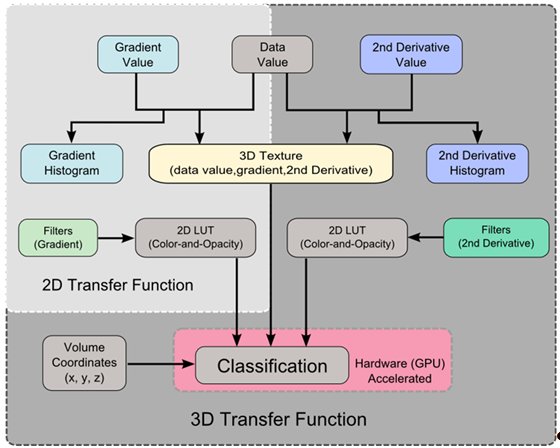
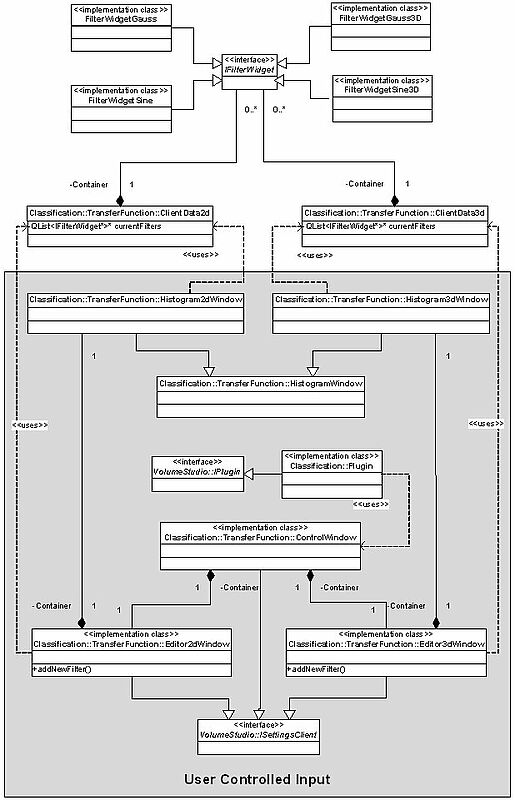
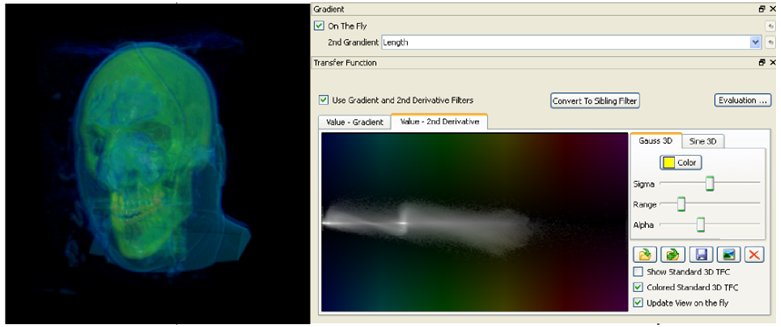
By analyzing the relationship between data value, gradient and the second derivative, the boundaries between multiple materials can be located by using filters. To facilitate the manipulation of transfer functions, the relationship between data value and gradient is shown in one histogram window, and the relationship between data value and the second derivative is shown in the other histogram window. Various types of filters are provided according to different requirements. Each filter has its own color and opacity value. When two or more filters overlap each other, their optical values are merged in the color-and opacity lookup table. Particularly, to perform the 3D transfer function, two sibling filters are created together. One is placed on the data value-gradient histogram, and the other is on the data value-second derivative histogram. The sibling filters have the constraint on x-axis and freedom on y-axis and are assigned to the same optical values. Instead of using conventional 3D lookup table to implement the 3D transfer function, our method utilizes dual 2D lookup tables in concerns of performance and efficiency in practice. The lookup tables are processed by GPU (hardware based acceleration) and thus been converted into color texture format in our implementation. About the evaluation of 3D classification results, two methods are applied: vision-based evaluation, numerical-analysis-based evaluation. The former heavily relies on the subjective perception of the observer and the latter provides a complementary objective view. The general idea of the numeric evaluation is to differentiate the classified voxels into different types, and rate them by credits used to compute the effectiveness of the classification result.